MIAMI — Miami-Dade single-family pending sales and total South Florida showing appointments increased year-over-year, according to July 2023 statistics released by the MIAMI Association of Realtors (MIAMI) and the Multiple Listing Service (MLS) system.
Miami-Dade single-family pending sales rose for the second consecutive month, increasing year-over-year from 1,016 to 1,032 transactions. While not all pending sales close, pending sales are an indicator of future sales. South Florida showing appointments, meanwhile, increased for the third consecutive month, jumping 8% year-over-year, from 208,359 in July 2022 to 224,187 in July 2023.
“Even with mortgage rates at 20-year highs, Miami real estate continues to show rising single-family pending sales and increasing condo luxury sales,” MIAMI Chairman Ines Hegedus Garcia said. “It’s a testament to South Florida’s market fundamentals—high percentage of cash buyers, rising year-over-year population – but a lack of inventory, particularly new listings, is impacting further growth for this high-demand market.”

Miami-Dade Single-Family Pending Sales Rise for Second Consecutive Month
It’s difficult to compare today’s home transactions to the roaring 2021-22 era, when mortgage rates hit an all-time low of 2.65%, a worldwide pandemic led to the expansion of remote work and a pandemic-fueled housing boom registered historic sales.
Miami total home sales decreased 13.6% year-over-year in July 2023, from a historic 2,375 transactions in July 2022 to 2,051 in July 2023, because of elevated mortgage rates and lack of supply in certain price points.
Most of the homes purchased in July 2023 came to terms in June when mortgage rates peaked at 6.71%. Rates, in comparison, were at 5.09% on June 2, 2022. Even with the elevated rates, Miami-Dade single-family pending sales rose for the second consecutive month, increasing year-over-year from 1,016 to 1,032 transactions.
Home sales are sensitive to mortgage rate changes. According to Freddie Mac, the 30-year fixed-rate mortgage averaged 7.09% as of August 17. That’s up from 6.96% the prior week and 5.13% one year ago.
“Miami-Dade’s price growth of over 10% is phenomenal at a time when mortgage rates are hovering at 7%, a strong indication of the pent-up demand that’s going to burst out as mortgage rates trend lower in 2024,” MIAMI REALTORS® Chief Economist Gay Cororaton said. “It’s tempting for buyers to wait for interest rates to decline. But keep in mind that there’s a shortage of homes for sale so prices are not likely going to fall, and expect buyer competition to intensify in 2024 as mortgage rates decline.”
Miami single-family home sales decreased 8.9% year-over-year, from 999 in July 2022 to 910 in July 2023 because of its comparison to a historic month and the current market has lower inventory in specific price points and higher rates.
Miami existing condo sales decreased 17.1% year-over-year, from a historic 1,376 in July 2022 to 1,141 in July 2023, due to lack of inventory and rising mortgage rates.

Miami Home Prices, Household Income Rise with Wealth Migration
Miami-Dade County single-family home median prices increased 10.8% year-over-year in July 2023, increasing from $570,000 to $631,670. Miami single-family median prices have risen for 140 consecutive months (11.7 years), the longest running-streak on record. Existing condo median prices increased 10.5% year-over-year to $420,000 from $380,000. Condo median prices have stayed even or increased in 140 of the last 146 months.
Miami ranks No. 4 in the U.S. annual home price appreciation, according to the latest US CoreLogic S&P Case-Shiller Index.
Historically, a market with less than 6 months of supply will have appreciating prices. Miami single-family homes and existing condos are at 3.2 and 5.1 months, respectively.
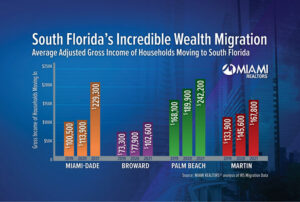
Local home prices have risen with South Florida’s wealth migration. In-migration boosted South Florida household income by $16 Billion in 2021, according to MIAMI REALTORS® analysis of the 2020-2021 migration data released by the Internal Revenue Service.

New households moving into Miami-Dade in 2021 had an average adjusted gross income of $229,300. New households moving into Broward County had an average adjusted gross income of $102,600. New households moving into Palm Beach County had an average adjusted gross income of $242,200.
Miami-Dade County’s population increased year-over-year in 2022, according to new U.S. Census Bureau population estimates. Miami-Dade is one of only 11 counties in the U.S. that are back to positive population growth in 2021-2022 after pandemic-driven population declines impacted the entire country, according to a new Brookings Institute report.
Miami-Dade Inventory, New Listings Still Near All-Time Lows
The monthly historical average for Miami-Dade inventory is 20,302 and current inventory is at 8,964. Total inventory is down 59.1% from pre-pandemic (July 2019), from 21,906 to 8,964.
Total active listings at the end of July decreased 10.1% year-over-year, from 9,973 to 8,964.
Inventory of single-family homes decreased 23.3% year-over-year in July 2023 from 3,727 active listings last year to 2,860 last month. Condominium inventory decreased 2.3% year-over-year to 6,246 from 6,104 listings during the same period in 2022.
New listings of Miami single-family homes decreased 23.4% to 1,255 from 1,639 year-over-year. New listings of condominiums decreased 18.2%, from 2,109 to 1,726 year-over-year.
Months’ supply of inventory for single-family homes increased 3.2% to 3.2 months year-over-year, which indicates a seller’s market. Inventory for existing condominiums increased 54.5% to 5.1 months, which also indicates a seller’s market. A balanced market between buyers and sellers offers between six- and nine-months supply.
Nationally, total housing inventory at the end of July was 1.11 million units, up 3.7% from June but down 14.6% from one year ago (1.3 million). Unsold inventory sits at a 3.3-month supply at the current sales pace, up from 3.1 months in June and 3.2 months in July 2022.
Miami Real Estate Posts $250.2 Million Local Economic Impact in July 2023
Every time a home is sold it impacts the economy: income generated from real estate industries (commissions, fees and moving expenses), expenditures related to home purchase (furniture and remodeling expenses), multiplier of housing related expenditures (income earned as a result of a home sale is re-circulated into the economy) and new construction (additional home sales induce added home production).
The total economic impact of a typical Florida home sale is $122,000, according to NAR. Miami-Dade sold 2,051 homes in July 2023 and had a local economic impact of $250.2 million.
Miami total dollar volume totaled $1.59 billion in July 2023. Single-family home dollar volume decreased 17.6% year-over-year to $846 million. Condo dollar volume decreased 5.4% year-over-year to $746 million.
Miami Distressed Sales Remain Low, Reflecting Healthy Market
Only 1.3% of all closed residential sales in Miami were distressed last month, including REO (bank-owned properties) and short sales, lower than 1.7% in July 2022. In 2009, distressed sales comprised 70% of Miami sales.
Short sales and REOs accounted for 0.3% and 0.9% year-over-year, respectively, of total Miami sales in July 2023.
Miami’s percentage of distressed sales are on par with the national figure. Nationally, distressed sales represented 1% of sales in July 2023, virtually unchanged from last month and the prior year.
Miami Median Price Appreciation Outperforming Nation, State
In Florida, closed sales of single-family homes statewide totaled 22,198 in July 2023, down 6.4% year-over-year, while existing condo-townhouse sales totaled 8,463, down 9.4%. Closed sales may occur from 30- to 90-plus days after sales contracts are written.
Nationally, total existing-home sales transactions waned 2.2% from June to a seasonally adjusted annual rate of 4.07 million in July. Year-over-year, sales slumped 16.6% (down from 4.88 million in July 2022).


