
As buyers and sellers in the real estate market, it is crucial for you to understand the correlation between various metrics that can greatly influence your decision-making process. Today, we will delve into the numbers and shed light on the current state of the market using the available data.
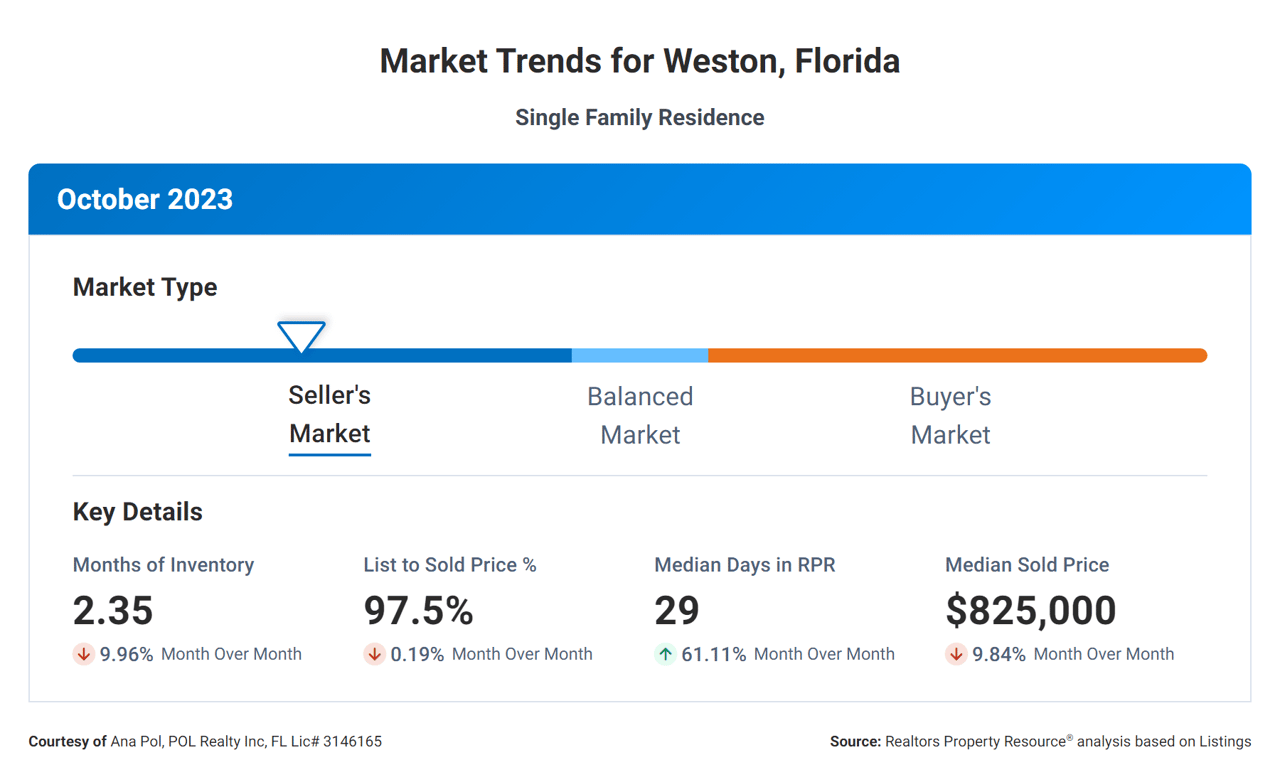
Let's start by analyzing the "Months Supply of Inventory," which currently stands at 2.35. This metric represents the number of months it would take to sell all the available homes on the market if no new properties were listed. A lower number indicates a tighter housing market, suggesting that demand is outpacing supply. In this case, the relatively low value of 2.35 suggests a limited inventory, potentially creating a competitive environment for buyers.
Moving on to the "12-Month Change in Months of Inventory," we observe a significant decrease of -27.02%. This figure represents the percentage change in the number of months it takes to sell all the inventory compared to the previous year. The negative value indicates a considerable reduction in the time it takes to sell properties. This decrease further emphasizes the tightening of the market, potentially leading to increased competition among buyers.
Next, we have the "Median Days Homes are On the Market," which currently stands at 29 days. This metric represents the average number of days it takes for a home to sell from the moment it is listed. With a relatively low value like 29 days, it suggests that homes are selling quickly. This rapid turnover can be attributed to the limited inventory and strong demand, making it a favorable market for sellers.
Now let's focus on the "List to Sold Price Percentage," which is at an impressive 97.5%. This metric indicates the percentage of the listing price that a home actually sells for. A higher percentage implies that sellers are achieving close to their asking prices, indicating a strong market where buyers are willing to meet the seller's expectations. This figure demonstrates the current market's resilience and competitiveness.
Lastly, we have the "Median Sold Price," which stands at a substantial $825,000. This metric represents the middle price point of all the homes sold in a specific area over a given period. With such a high median sold price, it suggests that the market is robust and in-demand. This figure also reflects the overall desirability of the area and the quality of the properties being sold.
In conclusion, the correlations between these real estate metrics paint a picture of a market with limited inventory, strong demand, and competitiveness. With a low months supply of inventory, a significant decrease in months of inventory compared to the previous year, and a short median days on the market, buyers should be prepared for a competitive landscape. On the other hand, sellers can expect to achieve a high list to sold price percentage and capitalize on the current market conditions. With a high median sold price, it is evident that the market is thriving and properties are in high demand.
As always, it is crucial to consult with real estate professionals who can provide personalized advice based on your specific situation and needs.